
Nice Rice
assessed
Nice Rice
assessed
assessed
Foodsteps Methodology
The Foodsteps carbon label helps you understand the impact of your food choices.
In the same way that there is guidance for how many calories, salt and fat we should eat in a day, the same has been calculated for carbon. This carbon budget is measured in kilograms of carbon dioxide equivalent per kilo (kg CO2e/kg) or more simply, carbon intensity. The Foodsteps rating system is based on this carbon budget and we've outlined below how the A to E ratings can support more sustainable diet choices.
These rating boundaries are set within the context of the commitment to meet the Paris Agreement pledge - keeping global warming to well below 2°C, aiming for 1.5°C. It includes an A-E Carbon Rating, where A is “Very Low” and E is “Very High.
Eating A-rated items will help you to stay within the EAT-Lancet 2050 global carbon budget for food, established in 2019 to help achieve healthy diets and sustainable food production.
Methods summary
Foodsteps completed a life cycle assessment of Nice Rice’s dry (i.e. uncooked) Basmati rice products in February 2026. The products under assessment were 1kg bags of wholegrain and white rice, and 500g of wholegrain and white Basmati rice.
The assessment followed the Greenhouse Gas Protocol Product Life Cycle Accounting and Reporting Standard and aligned to the principles and framework of ISO 14040. It uses a cradle-to-grave approach, encompassing emissions across the life cycle:
- Farming
- Milling
- Distribution to the UK
- Packaging
- Packing
- Distribution to retail
- Retail storage
- End-mile distribution
- Waste and losses
It does not include emissions from household use i.e. cooking.
Assessment Results
White rice
1kg of white rice (cradle-to-grave) - 1.27 kg CO2e / kg
500g of white rice (cradle-to-grave) - 0.65 kg CO2e / 500g
Wholegrain rice
1kg of wholegrain rice (cradle-to-grave) - 1.24 kg CO2e / kg
500g of wholegrain rice (cradle-to-grave) - 0.63 kg CO2e / 500g
Insights from the farm stage
Emissions from farms supplying Nice Rice paddy were modelled using primary data on chemical inputs (fertilisers, pesticides etc.), water use, irrigation techniques and farm yield. Or otherwise using average data from the region, such as for machinery and farm infrastructure. The lower carbon intensity can be partly attributed to the Alternate Wetting and Drying method. This practice reduces water consumption for irrigation and allows fields to dry periodically, limiting methane-producing bacteria which typically thrive in flooded rice fields. (Methane is a potent greenhouse gas!)
Farmers are trained to use chemical inputs only when necessary, rather than applied as standard, and manage leftover rice straw and stubble in line with the Sustainable Rice Platform (SRP) certification standards. Instead of open-field burning, an emissions-intensive practice, the rice straw is bailed and sold. Meanwhile stubble is mulched back into the soil, contributing to improved soil health.
Insights from the distribution to the UK
Emissions from distributing Nice Rice products to the UK are relatively significant when looking at the overall carbon footprint. The shipping journey from Mundra Port to the UK accounts for more than half of transport & storage emissions for this stage. Emissions from this journey are higher than usual due to a necessary diversion from the Red Sea around the Cape of Good Hope during the assessment period. If the typical route were followed, overall emissions from distribution to the UK would be 21% lower.
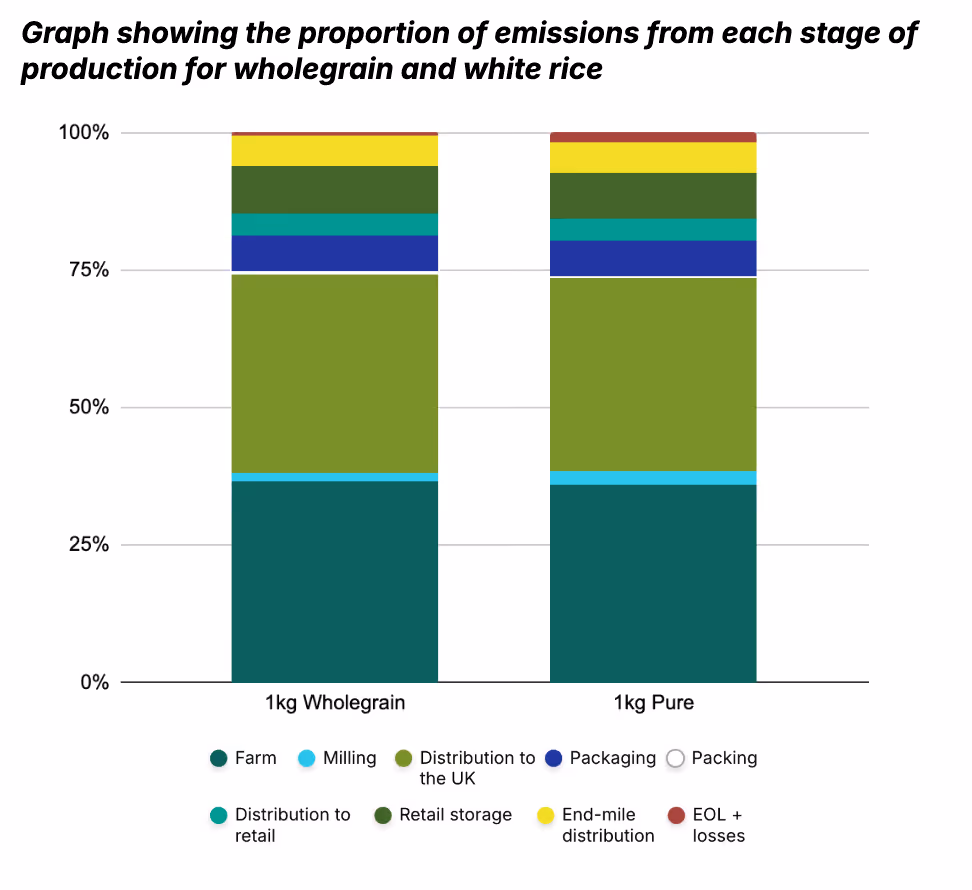
White vs wholegrain rice
Emissions from white rice are marginally higher than wholegrain rice due to additional milling steps to remove the bran and germ - a particularly energy intensive process known as polishing. More of the original farm product is lost through the production of white rice, also increasing impacts from waste and losses. It should be noted that these are key areas of uncertainty because they rely on data from average rice production systems, as opposed to direct information about Nice Rice’s operations.
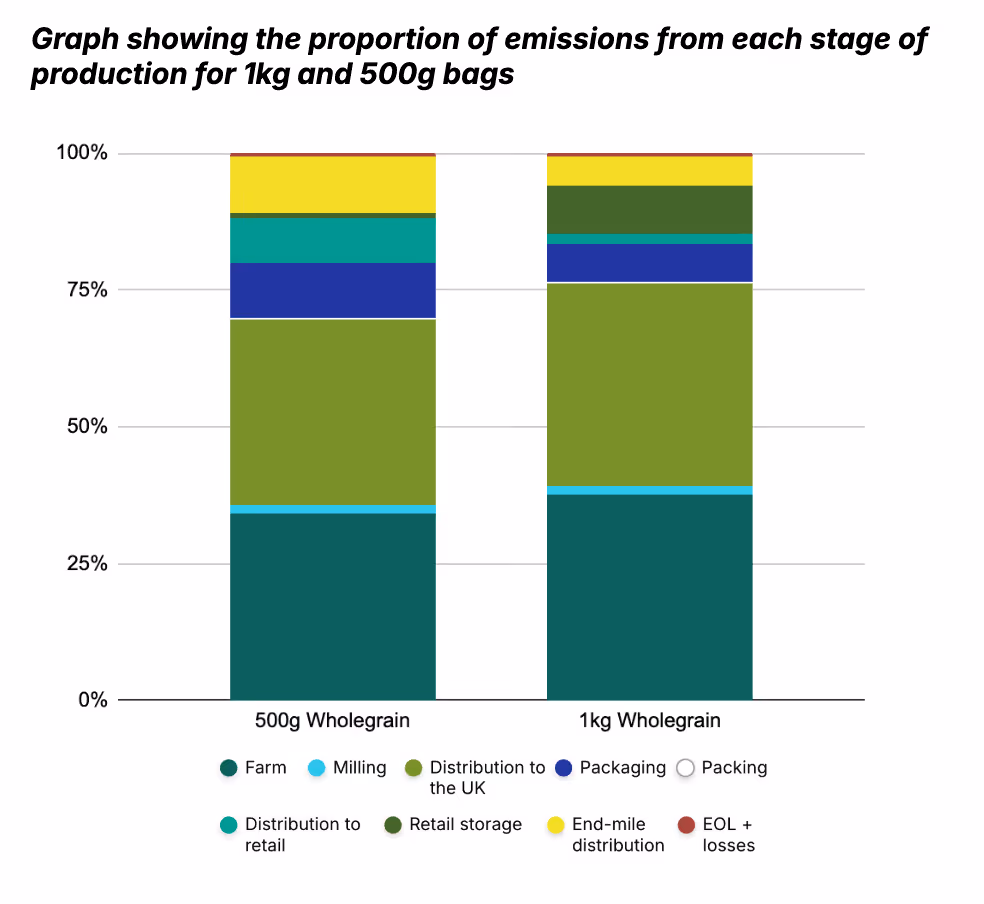
1kg vs. 500g bags
Once packed, 500g and 1kg bags follow slightly different production systems. Emissions from 500g bags are therefore not directly proportional to the 1kg bags. For example, the smaller 500g bags use more packaging materials proportionate to the amount of rice. Halving the amount of rice does not equate to halving the amount of packaging material. This means that packaging makes up a bigger proportion of the overall carbon footprint for 500g bags.
During the assessment period, 1kg bags were exclusively sold via wholesale retailers. Meanwhile the majority of 500g bags were distributed to households via Ocado. As a result, 1kg bags end up in storage for much longer periods of time, leading to higher impacts from energy consumption during storage.
This is counterbalanced by higher emissions from the end-mile distribution of 500g bags by Ocado delivery vans to consumer households. Conversely, some consumers may walk or cycle (zero emissions!) to and from shops stocking 1kg bags.
Cooking rice at home
Cooking is not included as part of the overall carbon footprint for 1kg and 500g bags of rice. Here are some considerations when choosing which product to buy and how to use it:
- Wholegrain rice takes longer to cook than white rice (and requires more water), meaning emissions from cooking wholegrain rice are likely to be higher.
- Rice cookers are more energy- and water-efficient than boiling rice on the hob. Especially if you’re using a gas hob, a rice cooker is likely to be the lower carbon option.
- Weighing out rice portions before you start cooking helps to limit the amount of waste. An average of 25% of rice is wasted after cooking!

Who are Foodsteps?
Foodsteps is a specialised food sustainability platform, enabling businesses to reduce the costs and risks of their Net Zero transition, and improve sales as a result. Our platform provides instant access to industry-leading data and insights that food services companies and food manufacturers can trust to accurately measure, reduce and report their environmental impact.
How does Foodsteps measure impact?
Our impact assessments are from cradle-to-grave. This means that they include the impact of all life cycle stages of the process of producing and consuming food - farm, processing, packaging, transport, retail, end-mile, cooking and food waste.
At Foodsteps, we use the best data wherever it is available. When data is not available, we use our own models to estimate the impact of some stages.
What are the different life cycle stages, and what do they mean?
There are many different stages within a food item’s life cycle that must be accounted for as emissions sources. We’ve curated an easy to understand list of key terms below.
Our Data Partners
We work in collaboration with leading organisations to improve and standardise food environmental impact data.

%201.svg)


FAQs
We adhere to the ISO 14040 standard, and are aligned to the GHG Protocol Life Cycle Accounting and Reporting Standard.
Carbon footprint is a measurement of the greenhouse gas emissions released during a product’s life cycle. It is measured in “kilograms of carbon dioxide equivalents (kg CO2e)”, to incorporate the relative impact of all types of greenhouse gases.
Carbon intensity is a measurement of the carbon footprint per kilogram of food (kg CO2e / kg of food). This measurement allows for a fair comparison between products of different serving sizes.


Carbon footprint scores cannot capture the full scope of food sustainability. Other environmental impacts like land use, water use and pollution are also important, as are social impacts such as fair pay and food security.
However, carbon footprint scores can still provide important insights into one of humanity's biggest challenges.


