
Our Method
Our Method
Foodsteps Methodology
What do these labels mean?
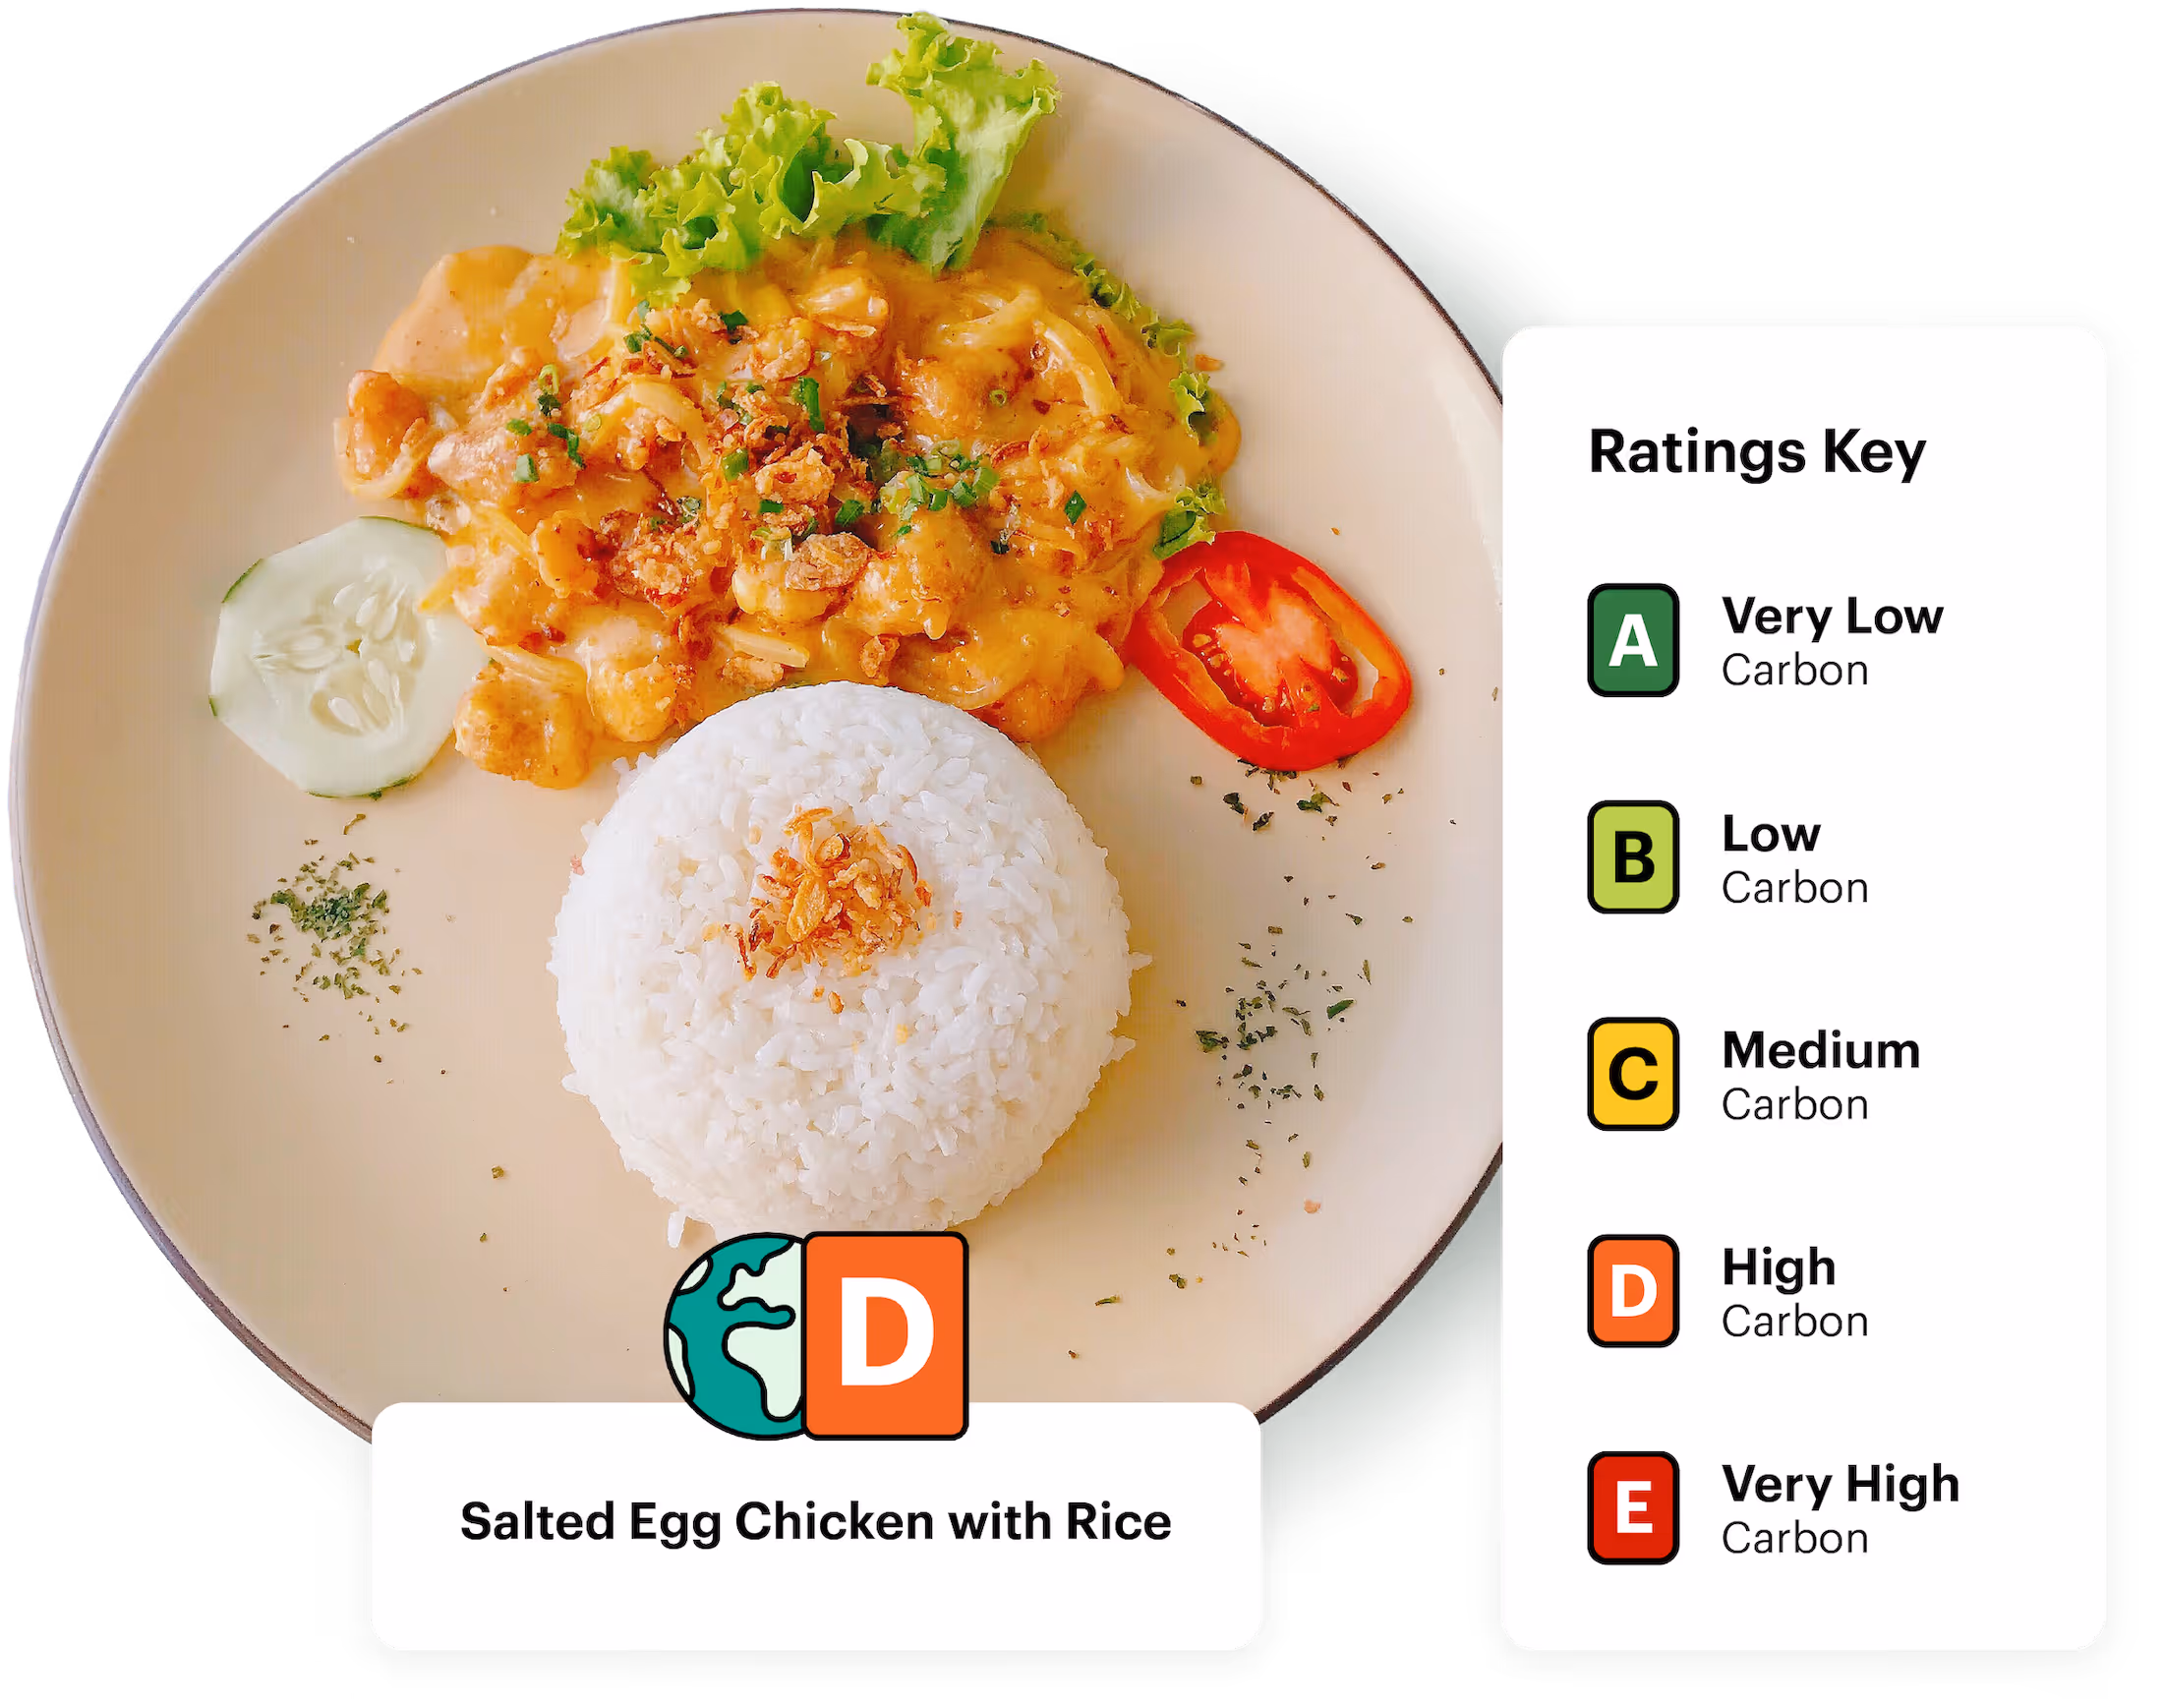
The Foodsteps carbon label helps you understand the impact of your food choices.
In the same way that there is guidance for how many calories, salt and fat we should eat in a day, the same has been calculated for carbon. This carbon budget is measured in kilograms of carbon dioxide equivalent per kilo (kg CO2e/kg) or more simply, carbon intensity. The Foodsteps rating system is based on this carbon budget and we've outlined below how the A to E ratings can support more sustainable diet choices.
These rating boundaries are set within the context of the commitment to meet the Paris Agreement pledge - keeping global warming to well below 2°C, aiming for 1.5°C. It includes an A-E Carbon Rating, where A is “Very Low” and E is “Very High.
Eating A-rated items will help you to stay within the EAT-Lancet 2050 global carbon budget for food, established in 2019 to help achieve healthy diets and sustainable food production.
The Foodsteps carbon label helps you understand the impact of your food choices.
It includes an A-E Carbon Rating, where A is “Very Low” and E is “Very High. The rating is based on the carbon intensity of the product. Eating A-rated items will help you to stay within the EAT-Lancet 2050 global carbon budget for food, established in 2019 to help achieve healthy diets and sustainable food production,
Who are Foodsteps?
Foodsteps are a UK based start-up that helps food businesses and consumers to understand the environmental impact of their food.
Foodsteps are a UK based start-up that helps food businesses and consumers to understand the environmental impact of their food.
How does Foodsteps measure impact?
Our impact assessments are from cradle-to-grave. This means that they include the impact of all life cycle stages of the process of producing and consuming food - farm, processing, packaging, transport, retail, end-mile, cooking and food waste.
At Foodsteps, we use the best data wherever it is available. When data is not available, we use our own models to estimate the impact of some stages.
Our impact assessments are from cradle-to-grave. This means that they include the impact of all life cycle stages of the process of producing and consuming food - farming, processing, packaging, transport, retail, cooking and food waste.
At Foodsteps, we use the best data wherever it is available. When data is not available, we use our own models to estimate the impact of some stages.
What standards does Foodsteps align to?
We adhere to the ISO 14040 standard, and are aligned to the GHG Protocol Life Cycle Accounting and Reporting Standard.
Our extensive database of peer-reviewed LCA studies is primarily sourced from the 2018 meta-analysis by Poore & Nemecek, which covers the impacts of many different ingredients from the farm stage up to the retail stage (including any processing, packaging, and transport in-between).
We have supplemented this with a wide range of data that is either publicly available or accessible to Foodsteps, using our links to academia, industry and research bodies. All data is recalculated and harmonised with our food impact database to ensure a consistent scope and specificity.
In order to achieve a cradle-to-grave (farm to end-of-life) assessment, Foodsteps has created our own unique models for the environmental impacts of post-retail stages. This includes the end-mile transport of food items (from the point of sale to consumption), the pre-preparation storage, cooking and post-preparation storage of food items, and the end-of-life disposal of any food that is wasted.
What are the different life cycle stages, and what do they mean?
There are many different stages within a food item’s life cycle that must be accounted for as emissions sources. We’ve curated an easy to understand list of key terms below.
There are many different stages within a coffee item’s life cycle that must be accounted for as emissions sources. We’ve curated an easy to understand list of key terms below.
FAQs
Carbon footprint is a measurement of the greenhouse gas emissions released during a product’s life cycle. It is measured in “kilograms of carbon dioxide equivalents (kg CO2e)”, to incorporate the relative impact of all types of greenhouse gases.
Carbon footprint is a measurement of the greenhouse gas emissions released during a product’s life cycle. It is measured in “kilograms of carbon dioxide equivalents (kg CO2e)”, to incorporate the relative impact of all types of greenhouse gases.
Carbon intensity is a measurement of the carbon footprint per kilogram of food (kg CO2e / kg of food). This measurement allows for a fair comparison between products of different serving sizes.
Carbon intensity is a measurement of the carbon footprint per kilogram of food (kg CO2e / kg of food). This measurement allows for a fair comparison between products of different serving sizes.
Carbon footprint scores cannot capture the full scope of food sustainability. Other environmental impacts like land use, water use and pollution are also important, as are social impacts such as fair pay and food security.
However, carbon footprint scores can still provide important insights into one of humanity's biggest challenges.


