

The Foodsteps Database
We provide food businesses data and tools they can trust to accurately measure, reduce, and report on their environmental impact.
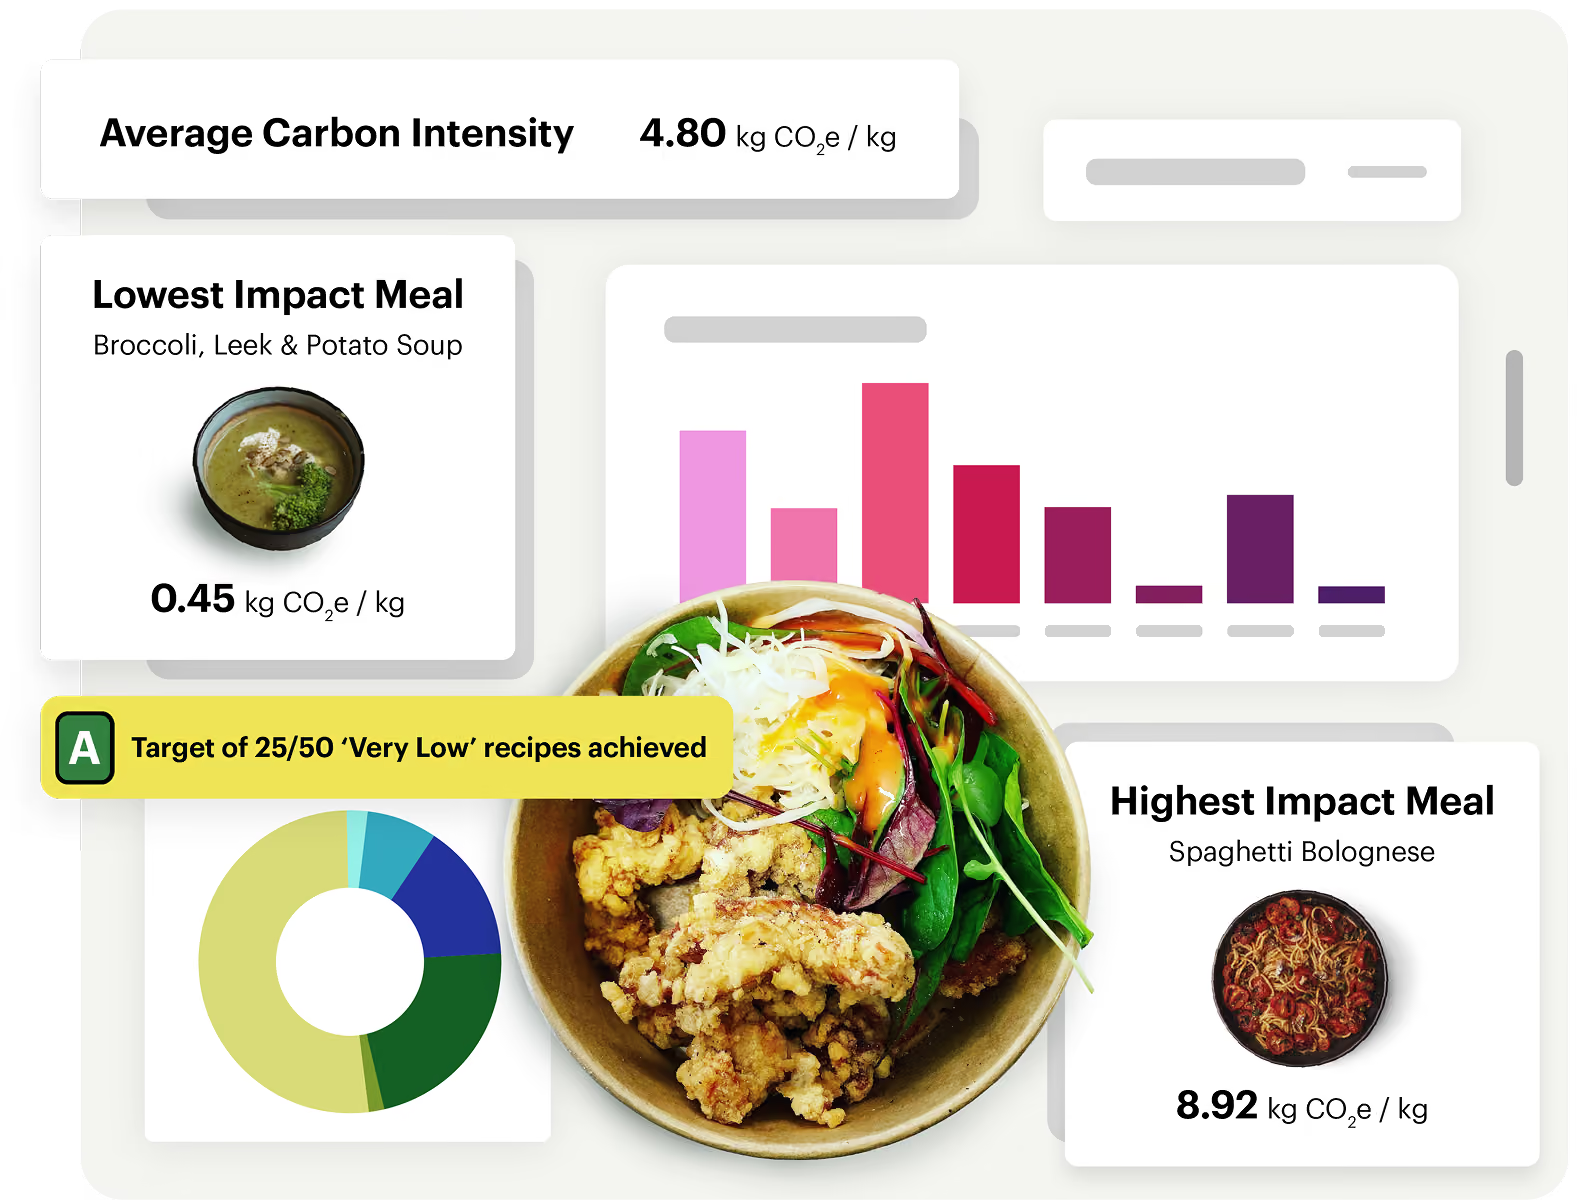
What Makes Our Data Different
Our emission factor database goes beyond generic industry averages to deliver highly specific, auditable data. We have over 45,000 unique emission factors and although we are proud of the quantity, we believe it’s the quality that matters more when it comes to environmental accounting.
Unlike other providers who rely on static, aggregated datasets from third parties, our dedicated in-house researchers are constantly updating our system to ensure we use the most accurate data in our calculations.
Our database has been built by food-industry experts, specifically for use by food and beverage businesses. Rather than manipulating generic emission factors, our platform provides insight into the products and processes that support food system decision-making.


Scientifically Robust
The foundation of Foodsteps’ database is more than 3,400 peer-reviewed academic life cycle assessments (LCA). The primary source is the 2018 meta-analysis by Poore & Nemecek, supplemented with a wide range of field and industry studies and datasets.
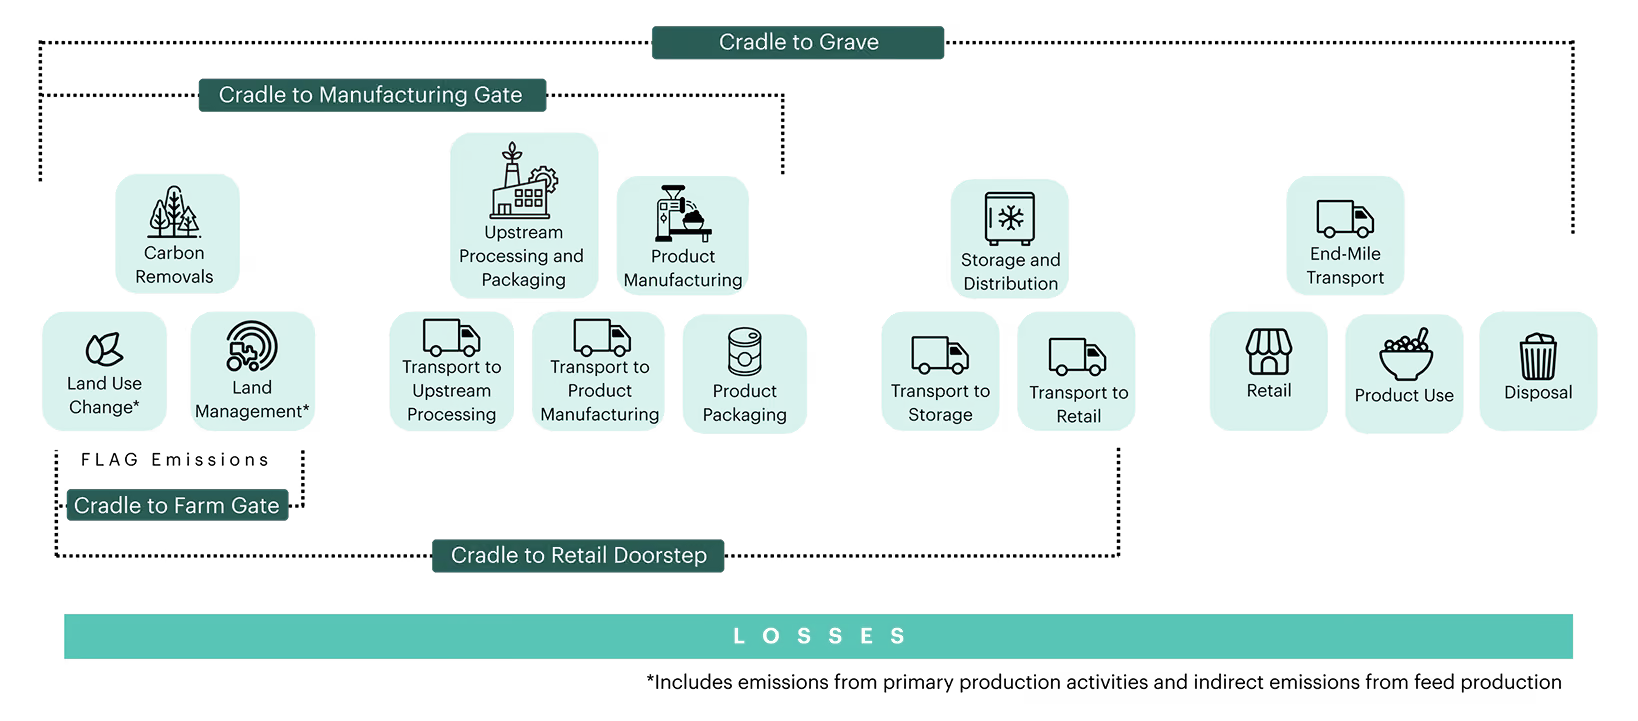
Through the addition of proprietary models built using data sourced from leading organisations like DEZNZ, US EPA, GLEC, FAOSTAT and BACI, Foodsteps consistently produces cradle-to-grave emission factors for over 4,800 distinct food classes.
All of Foodsteps’ secondary data is reviewed, recalculated and harmonised with our food impact database by an in-house team of researchers. This guarantees methodological consistency across the system boundary and ensures that all data is compatible with your specific use case before being applied in the required context.
We can produce emission factors to the system boundary that best supports your decision-making and reporting.

Standards-Aligned
Our database of emission factors is aligned to international standards and industry best practice.
Through working with leading research organisations and industry convenors, including HESTIA and WRAP, Foodsteps ensures that we are both contributing to and have access to the highest quality secondary datasets, with a particular focus on cradle-to-farmgate data.
Foodsteps data can be used to support business decisions across your whole journey to Net Zero, from identifying procurement hotspots and creating a decarbonisation roadmap, to setting a FLAG target or submitting to SBTi.



Granular
The Foodsteps database is highly granular, bringing an enhanced level of detail to your environmental footprint.

Product Specificity
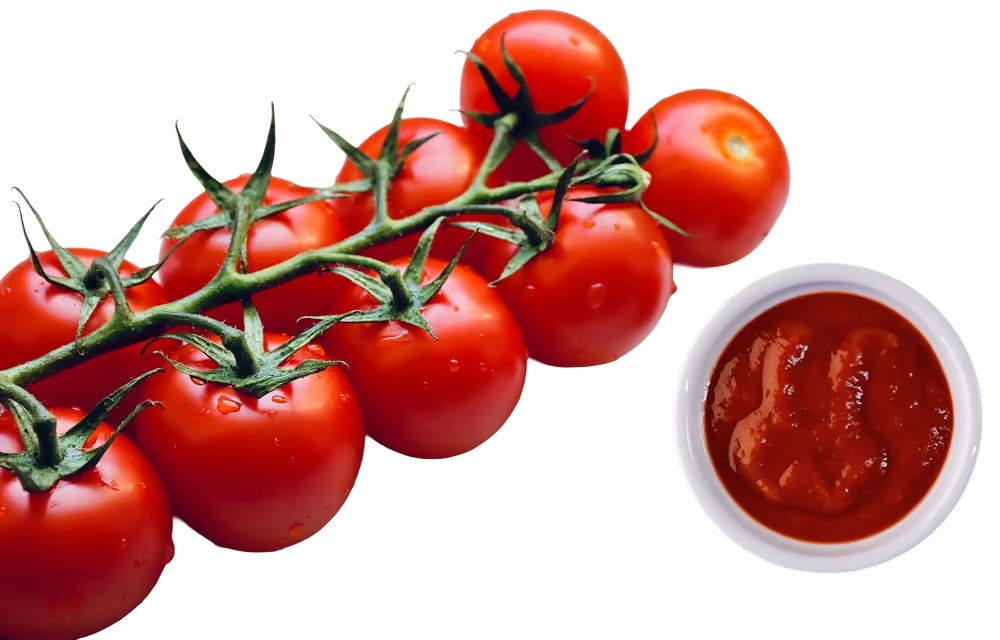
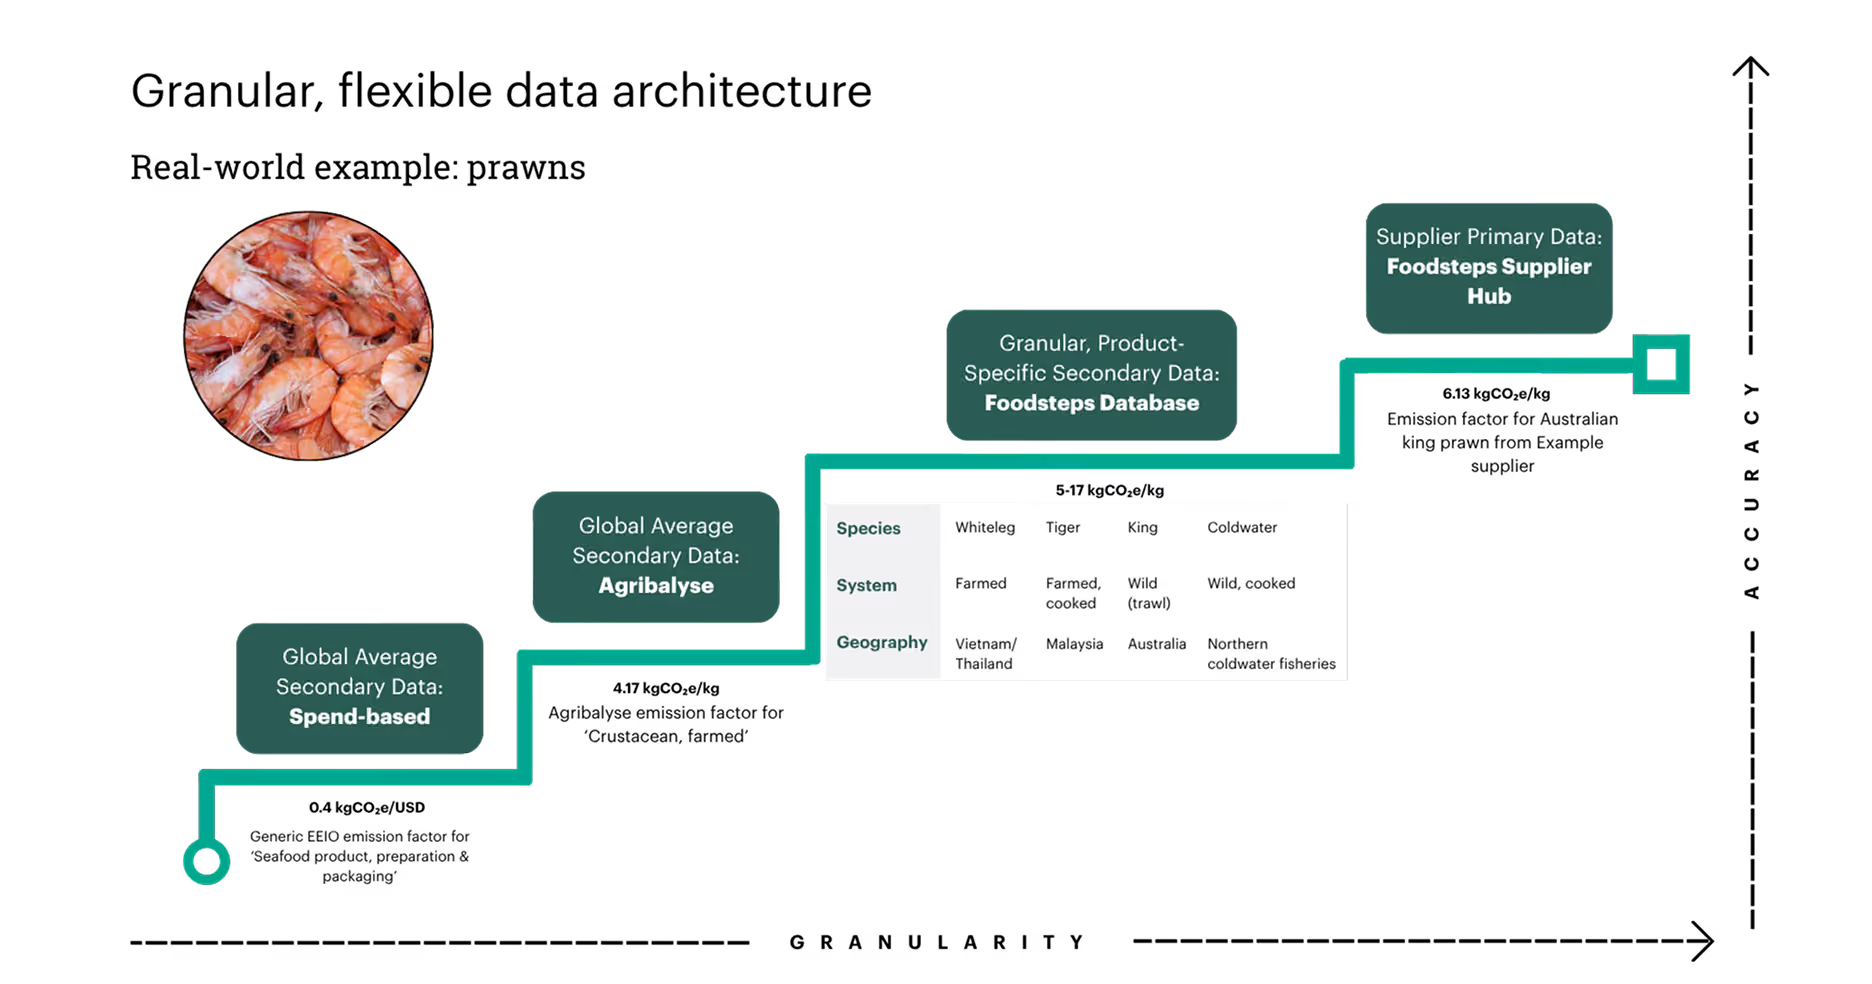
Rather than relying on industry or category averages, Foodsteps produces emission factors that match the real product you buy or sell. For example, you can choose emission factors for tomato paste rather than just ‘tomatoes’.

Geographic Specificity
The ability to choose from 147 production countries means we can differentiate between tomatoes grown in Spain and tomatoes grown in the Netherlands. By setting a consumption country, you can benefit from average sourcing models tailored to your geography even in the absence of specific sourcing data.

Full System Boundary Specificity
Foodsteps emission factors include modelled processes throughout the lifecycle. You can calculate the impact of specific packaging types, energy sources or transport details for emission factors that reflect your true production processes from cradle-to-grave.

Refine your emission factors over time with data from your suppliers to visualise supply chain decarbonisation in your own reporting.
Flexible
Bring your own data – or don’t.
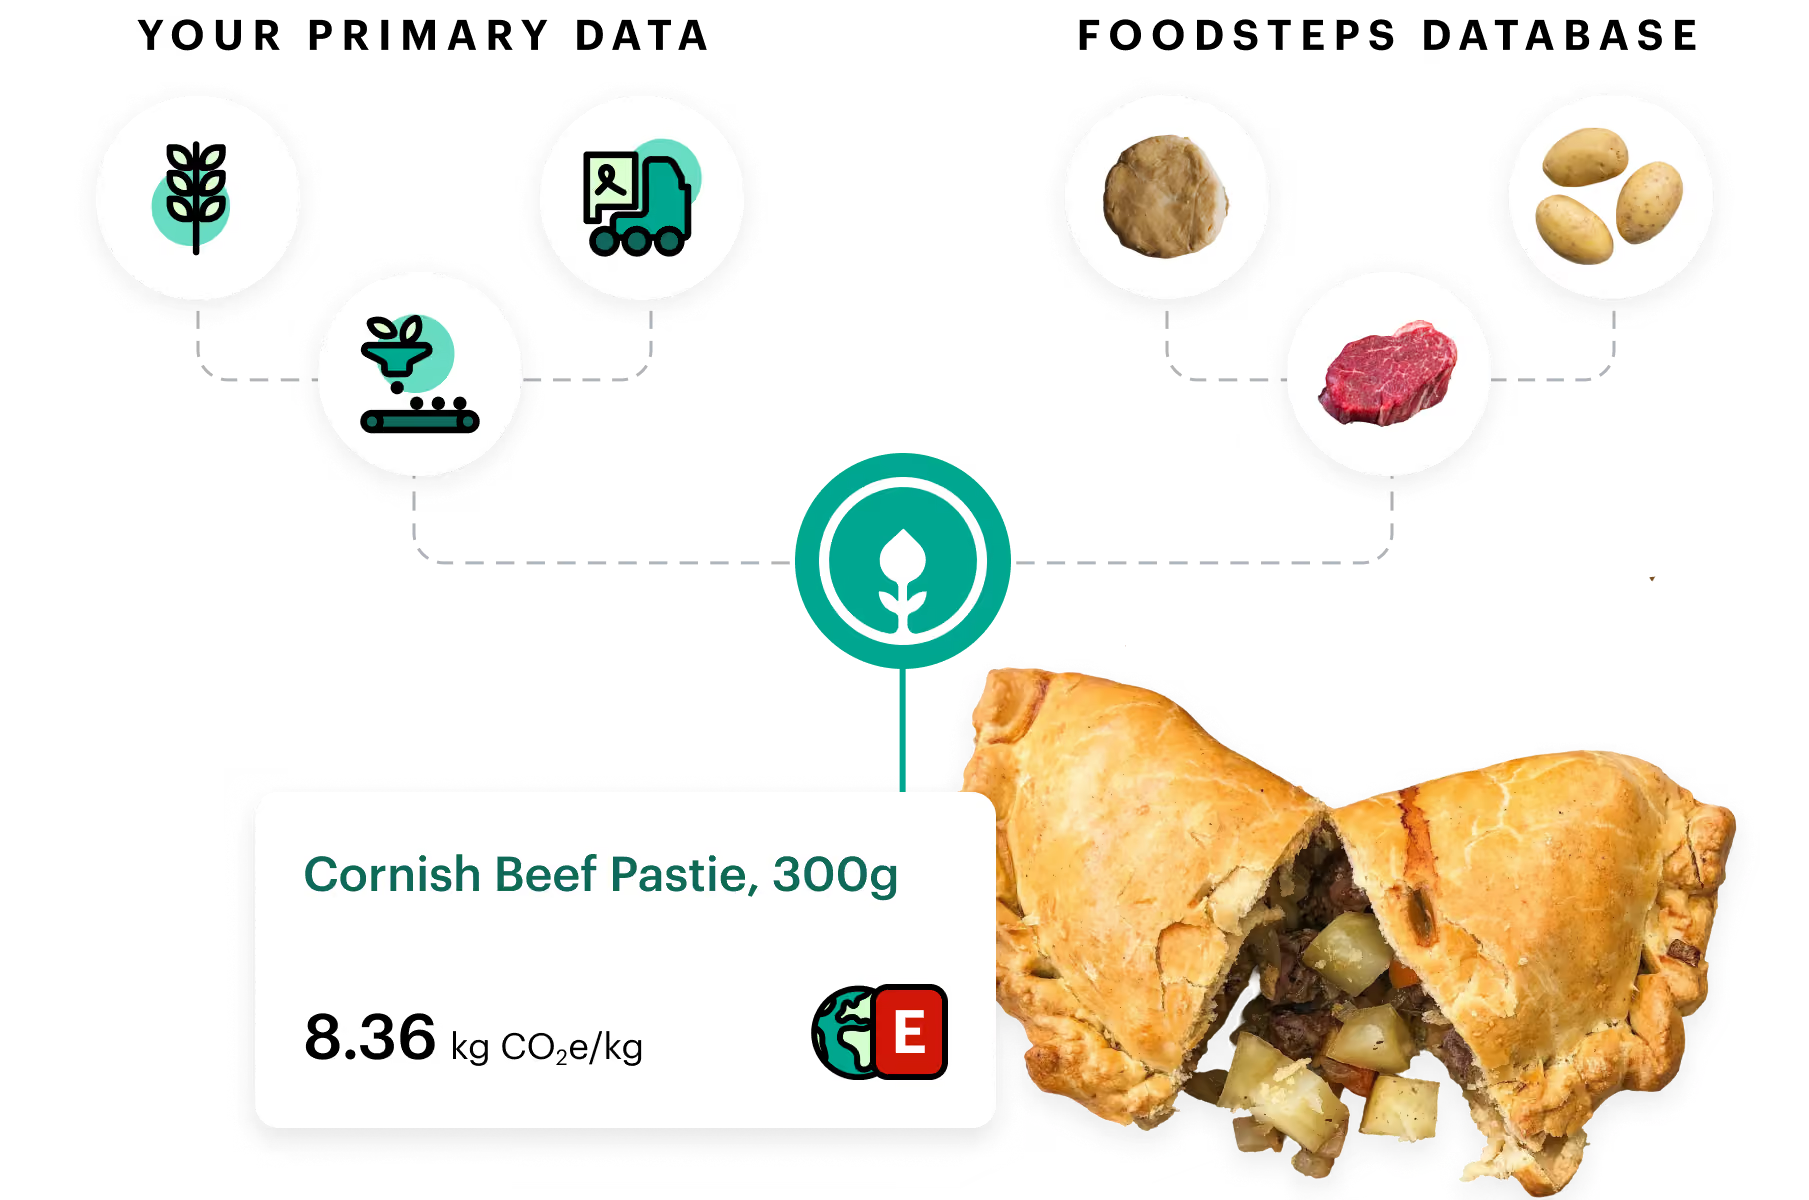
Foodsteps can ingest as much incremental primary data as is available, from farm-level metrics to supplier processing data, to ensure the efforts of businesses and their suppliers are reflected in assessments.
If primary data isn’t available, we use our robust and granular database of over 45,000 emission factors. Our solutions can be tailored to your business’s specific use cases and product range, from single-ingredients to complex food recipes.
Built For The Long Term
Our science team regularly updates the Foodsteps database with industry-leading research to ensure consistent access to high-quality data. Our dynamic emission factors are also consistently reviewed against themselves and your business, so as your operations change, our data changes with you.
Our solution lets you isolate real-world decarbonisation from improvements in underlying data and methodology, so you can have the confidence to understand the real drivers of changing emissions over time.
Built-in scalable automated data quality (DQ) metrics provide transparency and inform confidence in decision-making at a product and ingredient level, changing over time as new information from your business is added to our platform.
Sustainability Metrics
Environmental impact is about more than just carbon emissions, which is why we also measure land use and water use. For many food products, looking at carbon emissions alone doesnʼt tell the full story.




Foodsteps Methodology
Learn how we use our industry-leading data to calculate impact for our customers
